
Generate reports directly from Converia—not from ticketing, accounting, or Excel.

Converia keeps participation, payment, and booking data exactly where the conference is happening: in a single, shared database. This allows you to generate separate reports for each client as well as cross-conference analyses across your entire portfolio—without having to consolidate data from multiple tools.
Schedule a consultation
Request a demo
Request a demo
Generate reports directly from Converia—not from ticketing, accounting, or Excel

If you ask for figures, you rarely get a source.

Reporting rarely fails because of the report itself. It fails because the data is scattered beforehand:

Every client needs their own report

After a conference, clients expect figures on participants, revenue, and rates. If this data is scattered across ticketing systems, accounting software, and Excel, your team has to manually compile every report and filter out third-party client data.

The portfolio remains without comparison

How did the last conferences compare? Which pricing tiers were booked most frequently? Without a shared database, every event exists in its own silo—and any cross-portfolio analysis has to be done by hand.

Both have the same reason: the numbers aren't where the conference actually took place.

The numbers are already in the system. On three levels.

In many conference teams, reports are only created after the fact: attendee numbers from ticketing, revenue from accounting, and pricing from a spreadsheet. That is exactly where reporting turns into detective work—because none of it is connected.

In Converia, reporting isn't a separate step requiring a new tool. Registrations, payments, and pricing tiers are all stored in a single database for the entire conference. You can generate reports from this data on three levels:

Per conference:

Analyze and export participant, payment, and tariff data for an individual conference

Per client:

Generate reports separately for each client without mixing data between accounts

About the portfolio:

Cross-conference analysis – compare multiple meetings within the same system
What is captured during the conference serves as the source for the report—without the need for anyone to compile it a second time.
Evaluate individual conferences or your entire portfolio

Evaluate individual conferences or your entire portfolio.

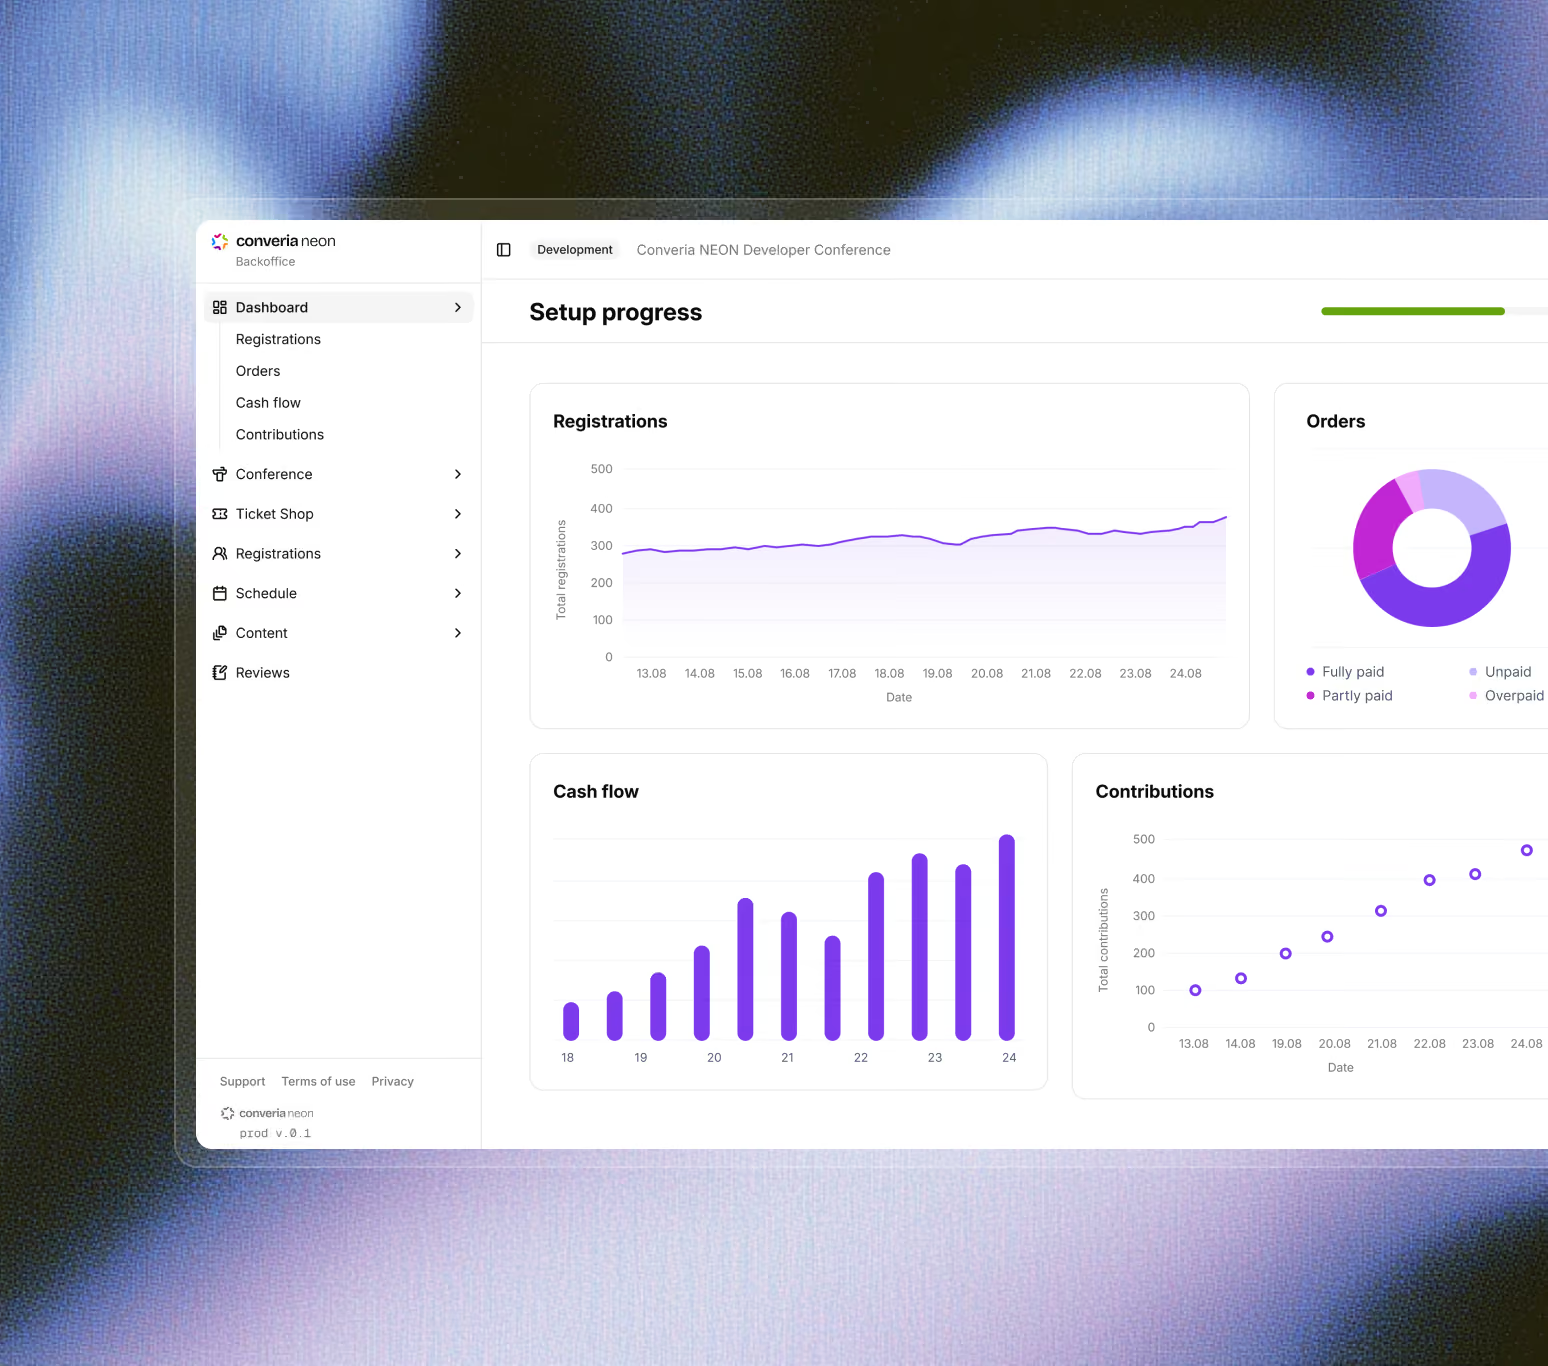
Participation, payment, and tariff data for each conference are stored separately within the same database as registration and payment information. This allows you to create client-specific reports without including third-party data or manually consolidating figures.

Features:
Analyze participant, payment, and tariff data for each conference
Create reports without including data from other clients
Export invoices, bookings, contacts, fees, and program data to Excel
Transfer data to your CRM or membership management system via REST API
Reports are generated during the conference process, not as a post-quarter cleanup task.

See how you can create meaningful reports from your event data in an online demo.

Watch online demo
Watch online demo
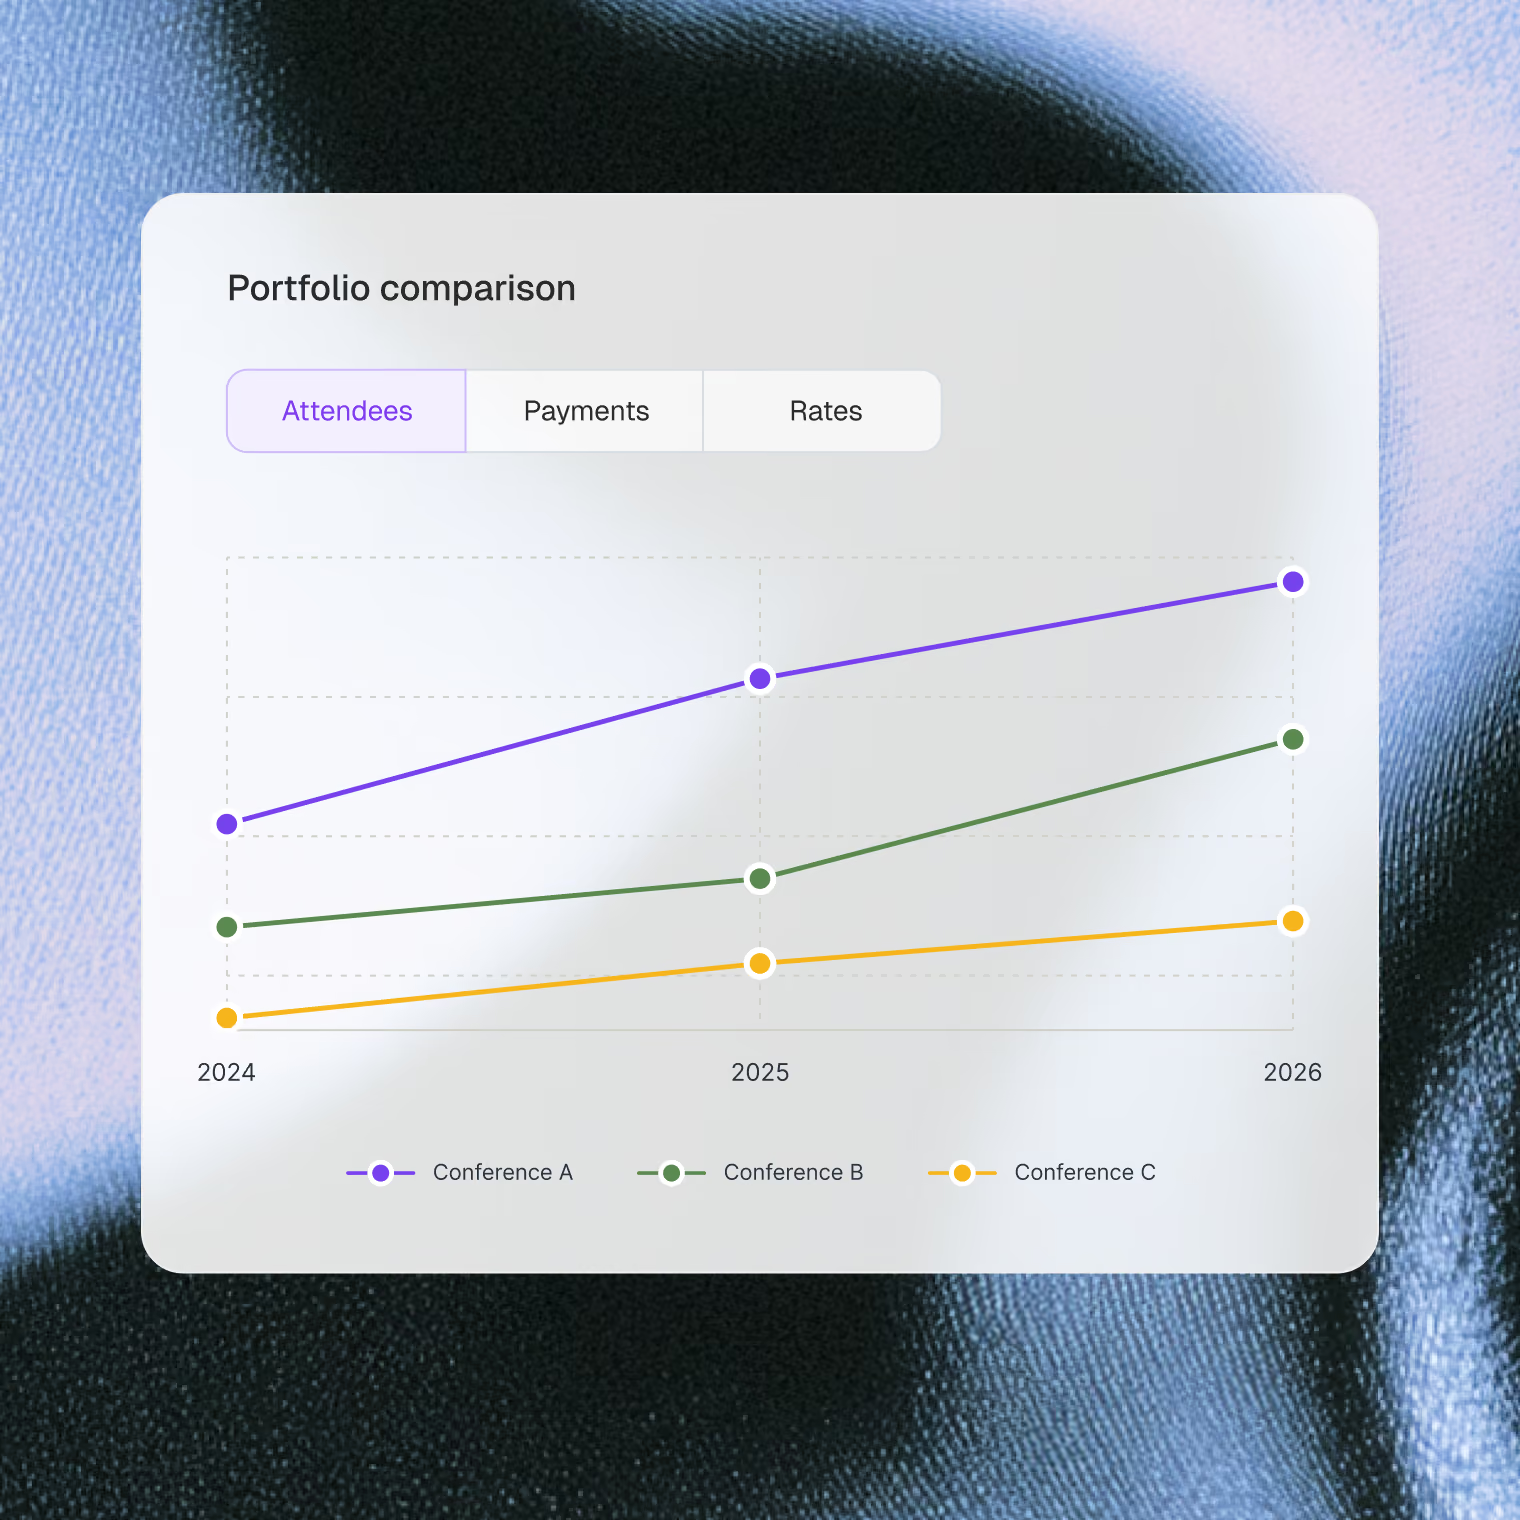
Compare conferences across your entire portfolio

Compare conferences across your entire portfolio.

All conferences run on the same system. This allows you to compare participants, payments, and rates across events and identify trends between recurring editions—without having to prepare each conference individually.

Features:
Analyze multiple conferences together
Consolidate participation, payment, and pricing data across your entire portfolio
Compare recurring conferences from one edition to the next
Export reports by conference and client
Converia thus becomes the unified reporting system for all clients and events – instead of using a separate tool for each conference.